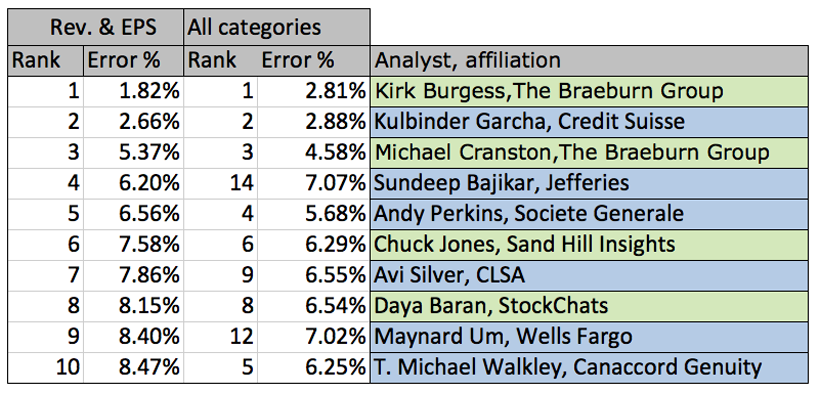
This was like one of those quarters in the early days of the iPhone era, when Apple surprised everybody, even the most bullish amateur analysts. In this kind of quarter, the prize goes to the biggest bull and the bears just look bad.
The difference between this grande-blowout and a venti-blowout like Q1 2012 (iPhone 4S/iPad 2) is that this time there are bullish pros up there with the amateurs and bearish amateurs down below with the pros. The two groups are getting shuffled like a deck of cards.
A bit of historical perspective. The revenue accuracy graph below shows the performance of the two groups — pros and amateurs — over time. Both have had their good quarters and bad. But at the 20-quarter mark, the amateurs are doing significantly better. They tend to overshoot on the bullish side — by 2.3% on revenue and 2.8% on EPS. The pros err by an even larger margin on the bearish side — missing revenue on average by -3.9% and EPS by -8.5%. Below: Our annotated master spreadsheet, with the best estimates highlighted in bright green, the second and third best in light green, the worst in red and the second and third worst in pink. Thanks once again to Posts at Eventide‘s Robert Paul Leitao for pulling together the Braeburn Group numbers. Follow Philip Elmer-DeWitt on Twitter at @philiped. Read his Apple AAPL coverage at fortune.com/ped or subscribe via his RSS feed. A few performances worth noting: