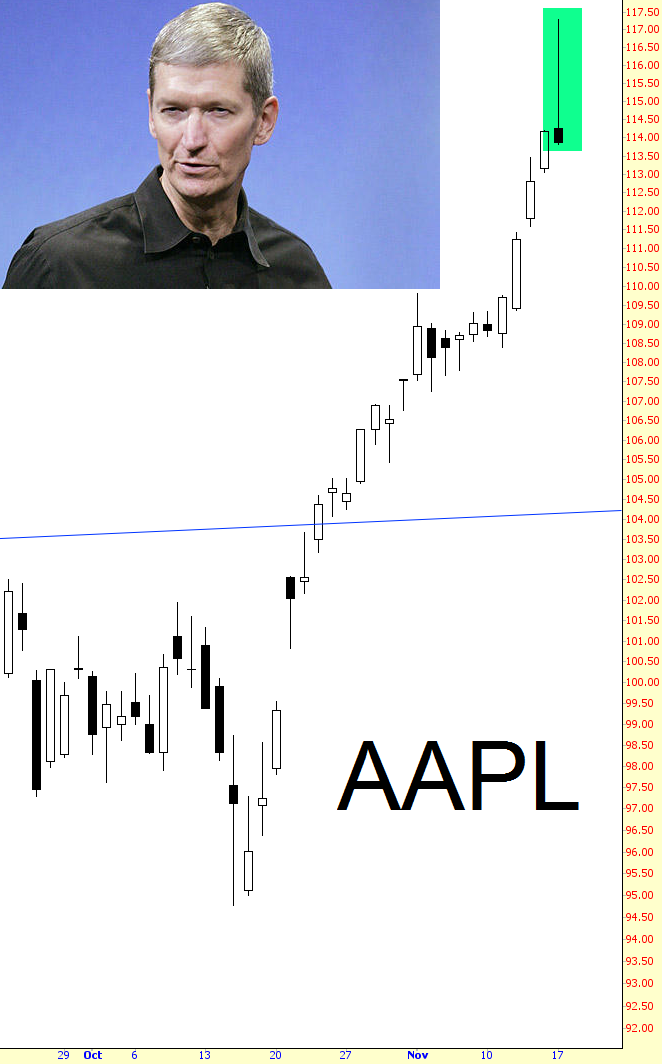
See the pattern highlighted in green, next to the photo of Tim Cook looking irritable? That stubby body and long tail?
That’s what technical analysts call a Shooting Star candlestick. Shooting Stars are bearish signals in the best of times, a sign that an uptrend may have peaked.
But this one, with its extra-long tail, is what Slope of Hope’s Tim Knight (who created the collage) called a “Big Ass Shooting Star.” It was a loud warning bell to traders — and trading algorithms — that it was probably time to take their profits and run.
Or it would have been if the trade that created that extra-long tail — the one that took Apple Monday to a new all-time high of $117.28 — were real.
But it wasn’t real. It was an artifact of the options market that made it look like someone on the Chicago Stock Exchange had bought $1.26 million worth of Apple for 2% above market price — something nobody in their right mind would do.
It was a phantom trade, a chimera, yet it was duly posted as Apple’s 52-week high on financial sites around the Web — including Google and Yahoo — where it still stands two days later.
These outliers surface from time to time, but Apple seems to get more than its share.
This kind of thing drives day traders crazy. They watch for all-time highs and Shooting Stars. They set up complicated conditional trades based on a stock hitting pre-set marks. And the biggest traders — the ones that account for most of the daily volume in a stock like Apple — are computer programs whose internal logic is beyond human ken. Who knows what they are thinking?
Hello, SEC? Anybody watching this?
See also: Five fat fingers before noon Friday. What gives?
Follow Philip Elmer-DeWitt on Twitter at @philiped. Read his Apple (AAPL) coverage at fortune.com/ped or subscribe via his RSS feed.